At Comcast, we have a large on-premise Trino cluster. It enables us to extract insights from data no matter where it resides, and prepares the company for a more cloud-centric future. Recently, however, we experienced and overcame challenges related to the Java virtual machine (JVM). We wanted to share what we encountered and learned in hopes that it might be useful for the Trino community.
JIT recompilation #
Some users complained that nightly reports were taking far too long to complete. Queries that ran for six hours made very little progress.
First, we looked at the queries involved in these nightly reports. We noticed that all these queries involved two particular tables. In this post, let’s call them table A and table B.
Our initial suspicion was that there could be an issue with the table data in HDFS. Thus, we tried to reproduce the performance problem by using queries that performed simple scans against these tables.
We tried a simple table scan with no filters, range filter on a partitioned column, etc., ran these queries multiple times and execution times were consistent. This ruled out a potential problem with HDFS.
Next, we took a closer look at the portion of the slow running queries involving table A, and came up with the simplest possible query that could demonstrate the problem. We discovered that the following query did not exhibit the performance problem:
SELECT
 count(a.c1)
FROM
 hive.schema1.A a, hive.schema2.B da
WHERE
 a.day_id = da.date_id
 AND a.day_id BETWEEN '2021-03-22' AND '2021-04-21'
But adding a predicate, a.c2 = '4 (Success)', caused the performance problem
to appear:
SELECT
 count(a.c1)
FROM
 hive.schema1.A a, hive.schema2.date_dim da
WHERE
 a.day_id = da.date_id
 AND a.day_id BETWEEN '2021-03-22' AND '2021-04-21'
 AND a.c2 = '4 (Success)'
We narrowed the problem down to the Scan/Filter/Project operator using the
output of EXPLAIN ANALYZE from Trino. For the query that performed as
expected, this stage had the following CPU stats:
CPU: 2.39h, Scheduled: 4.47h, Input: 17434967615 rows (357.47GB)
For the version of the query with the additional predicate, a.c2 = '4 (Success)',
that exhibited the performance problem, the same stage has the following CPU
stats:
CPU: 3.73d, Scheduled: 48.01d, Input: 17052985227 rows (413.98GB)
This shows that for roughly the equivalent amount of data, Trino used significantly more CPU (3.73 days to 2.39 hours!!). Our next step was to determine possible reasons.
We generated a few jstack and Java flight recorder (JFR) profiles of the Trino Java process from one of the worker nodes while the scan stage was running. After analyzing these profiles, we found no obvious problem. Trino performed as expected.
Next, we looked at the list of tasks in the web UI to see what the distribution of CPU times for each stage was:
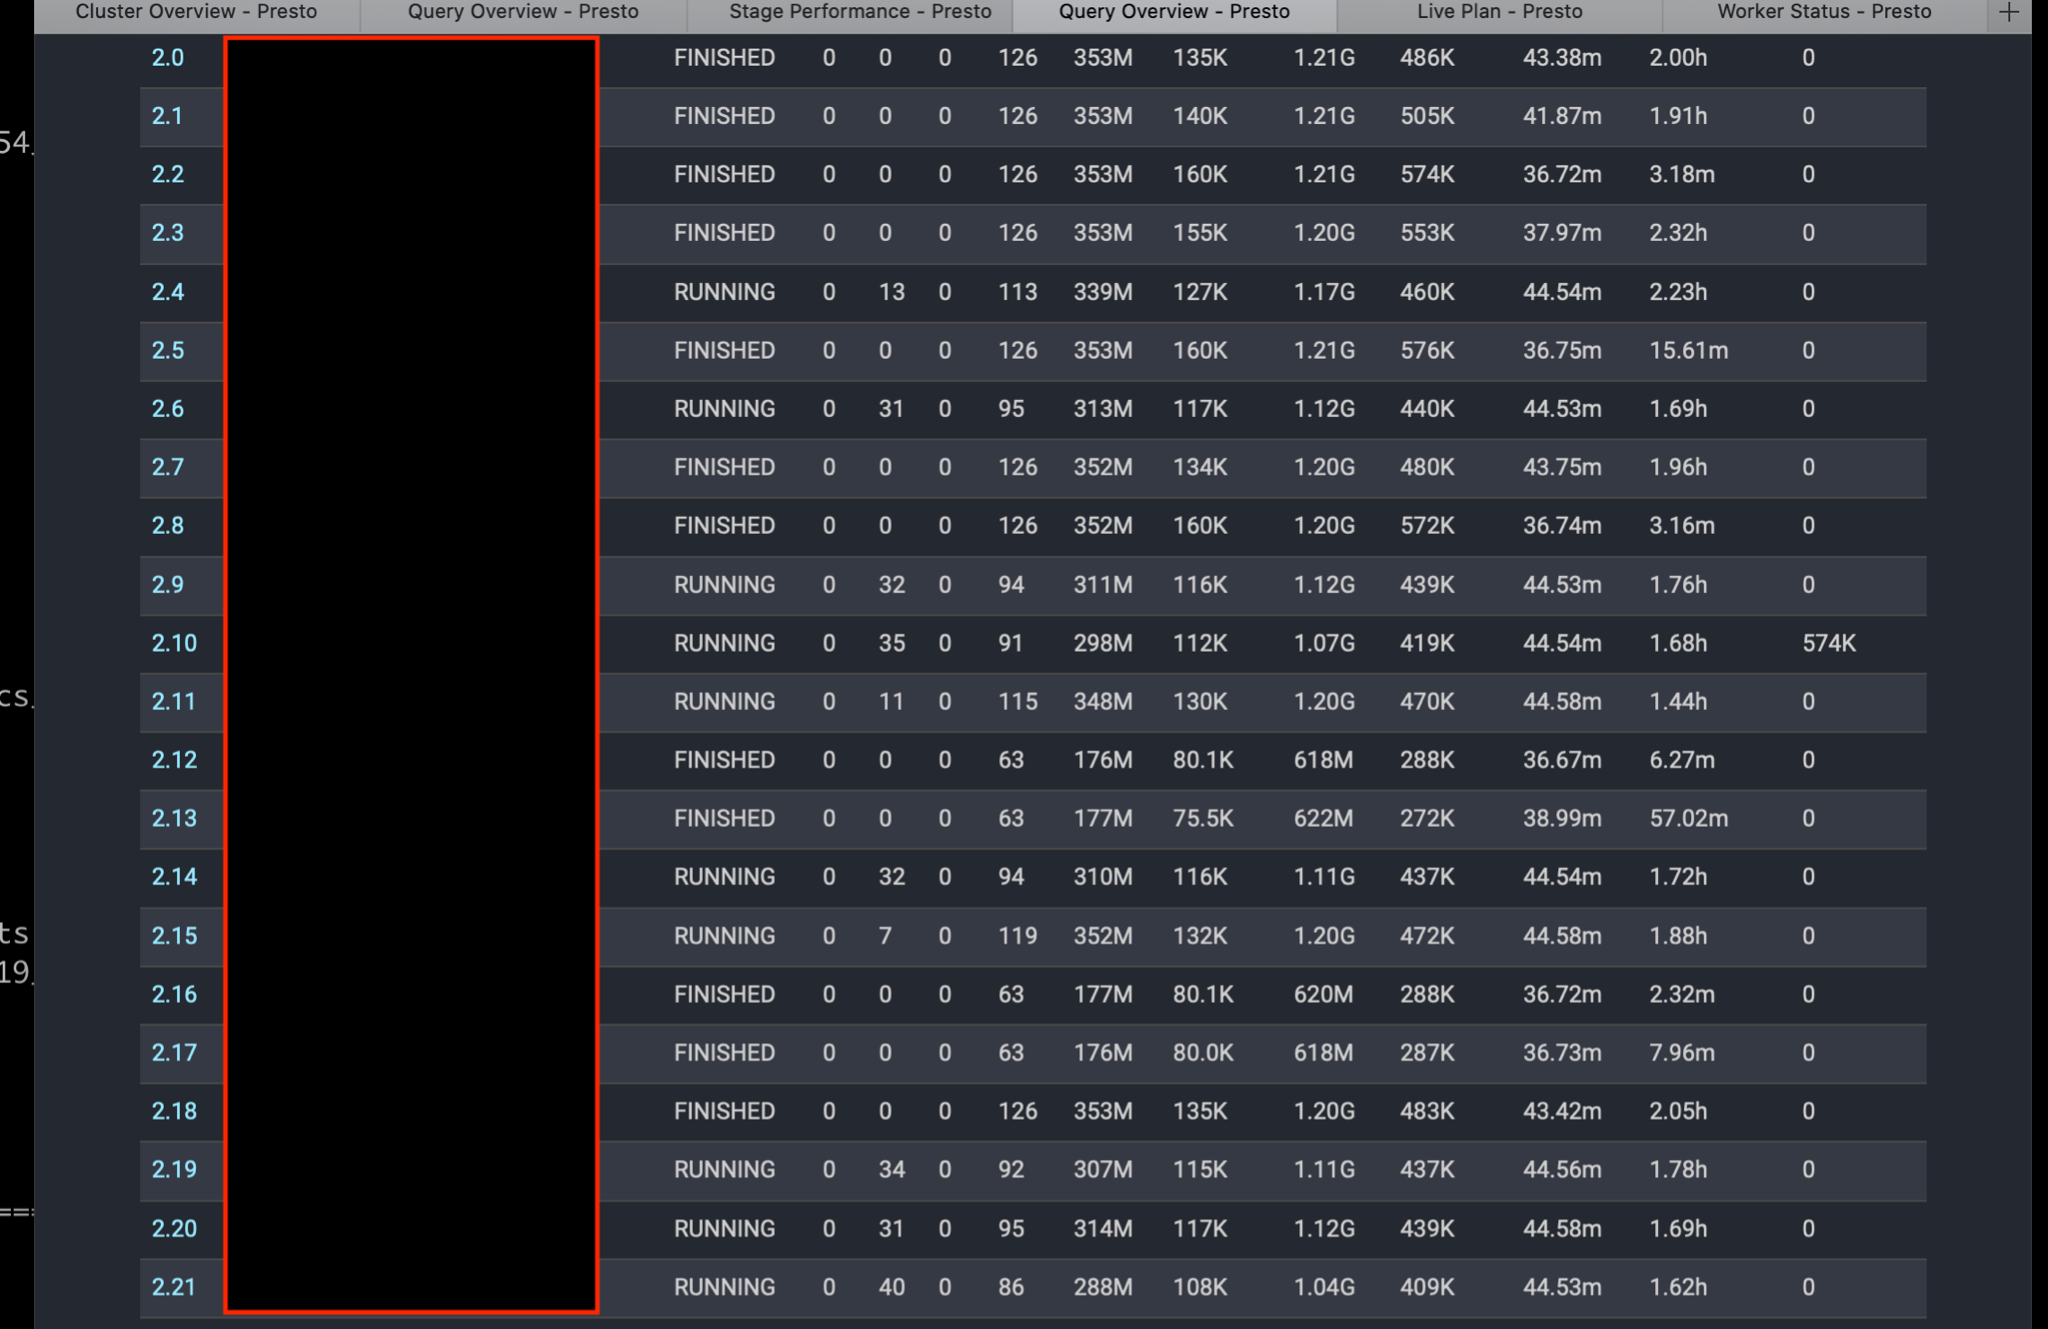
Some workers have tasks that only use up a few minutes of CPU time and others have tasks that use up to 2 hours of CPU time! Different query runs would show this would happen to different workers so it was not a problem with any one individual worker.
We discussed this with Starburst engineer, Piotr Findeisen, and came to the conclusion that this could potentially be an issue with JVM code deoptimization. After re-compiling a method a certain number of times, the JVM refuses to do so any more and will run the method in interpreted mode, which is much slower.
The evidence for this is what we highlighted above: that the CPU used by the same tasks on different workers vary by a factor of approximately 30. This is the typical difference for compiled versus interpreted code, according to Piotr’s experience at Starburst.
The following JVM options were added to the Trino jvm.config file to help
with this issue:
-XX:PerMethodRecompilationCutoff=10000-XX:PerBytecodeRecompilationCutoff=10000
These settings increased the recompilation cutoff limit. They are now also
included in the default jvm.config settings that ship with Trino since the
348 release.
Since we have been running Trino in production for some time, we did not have
these settings in our jvm.config.
Initial results #
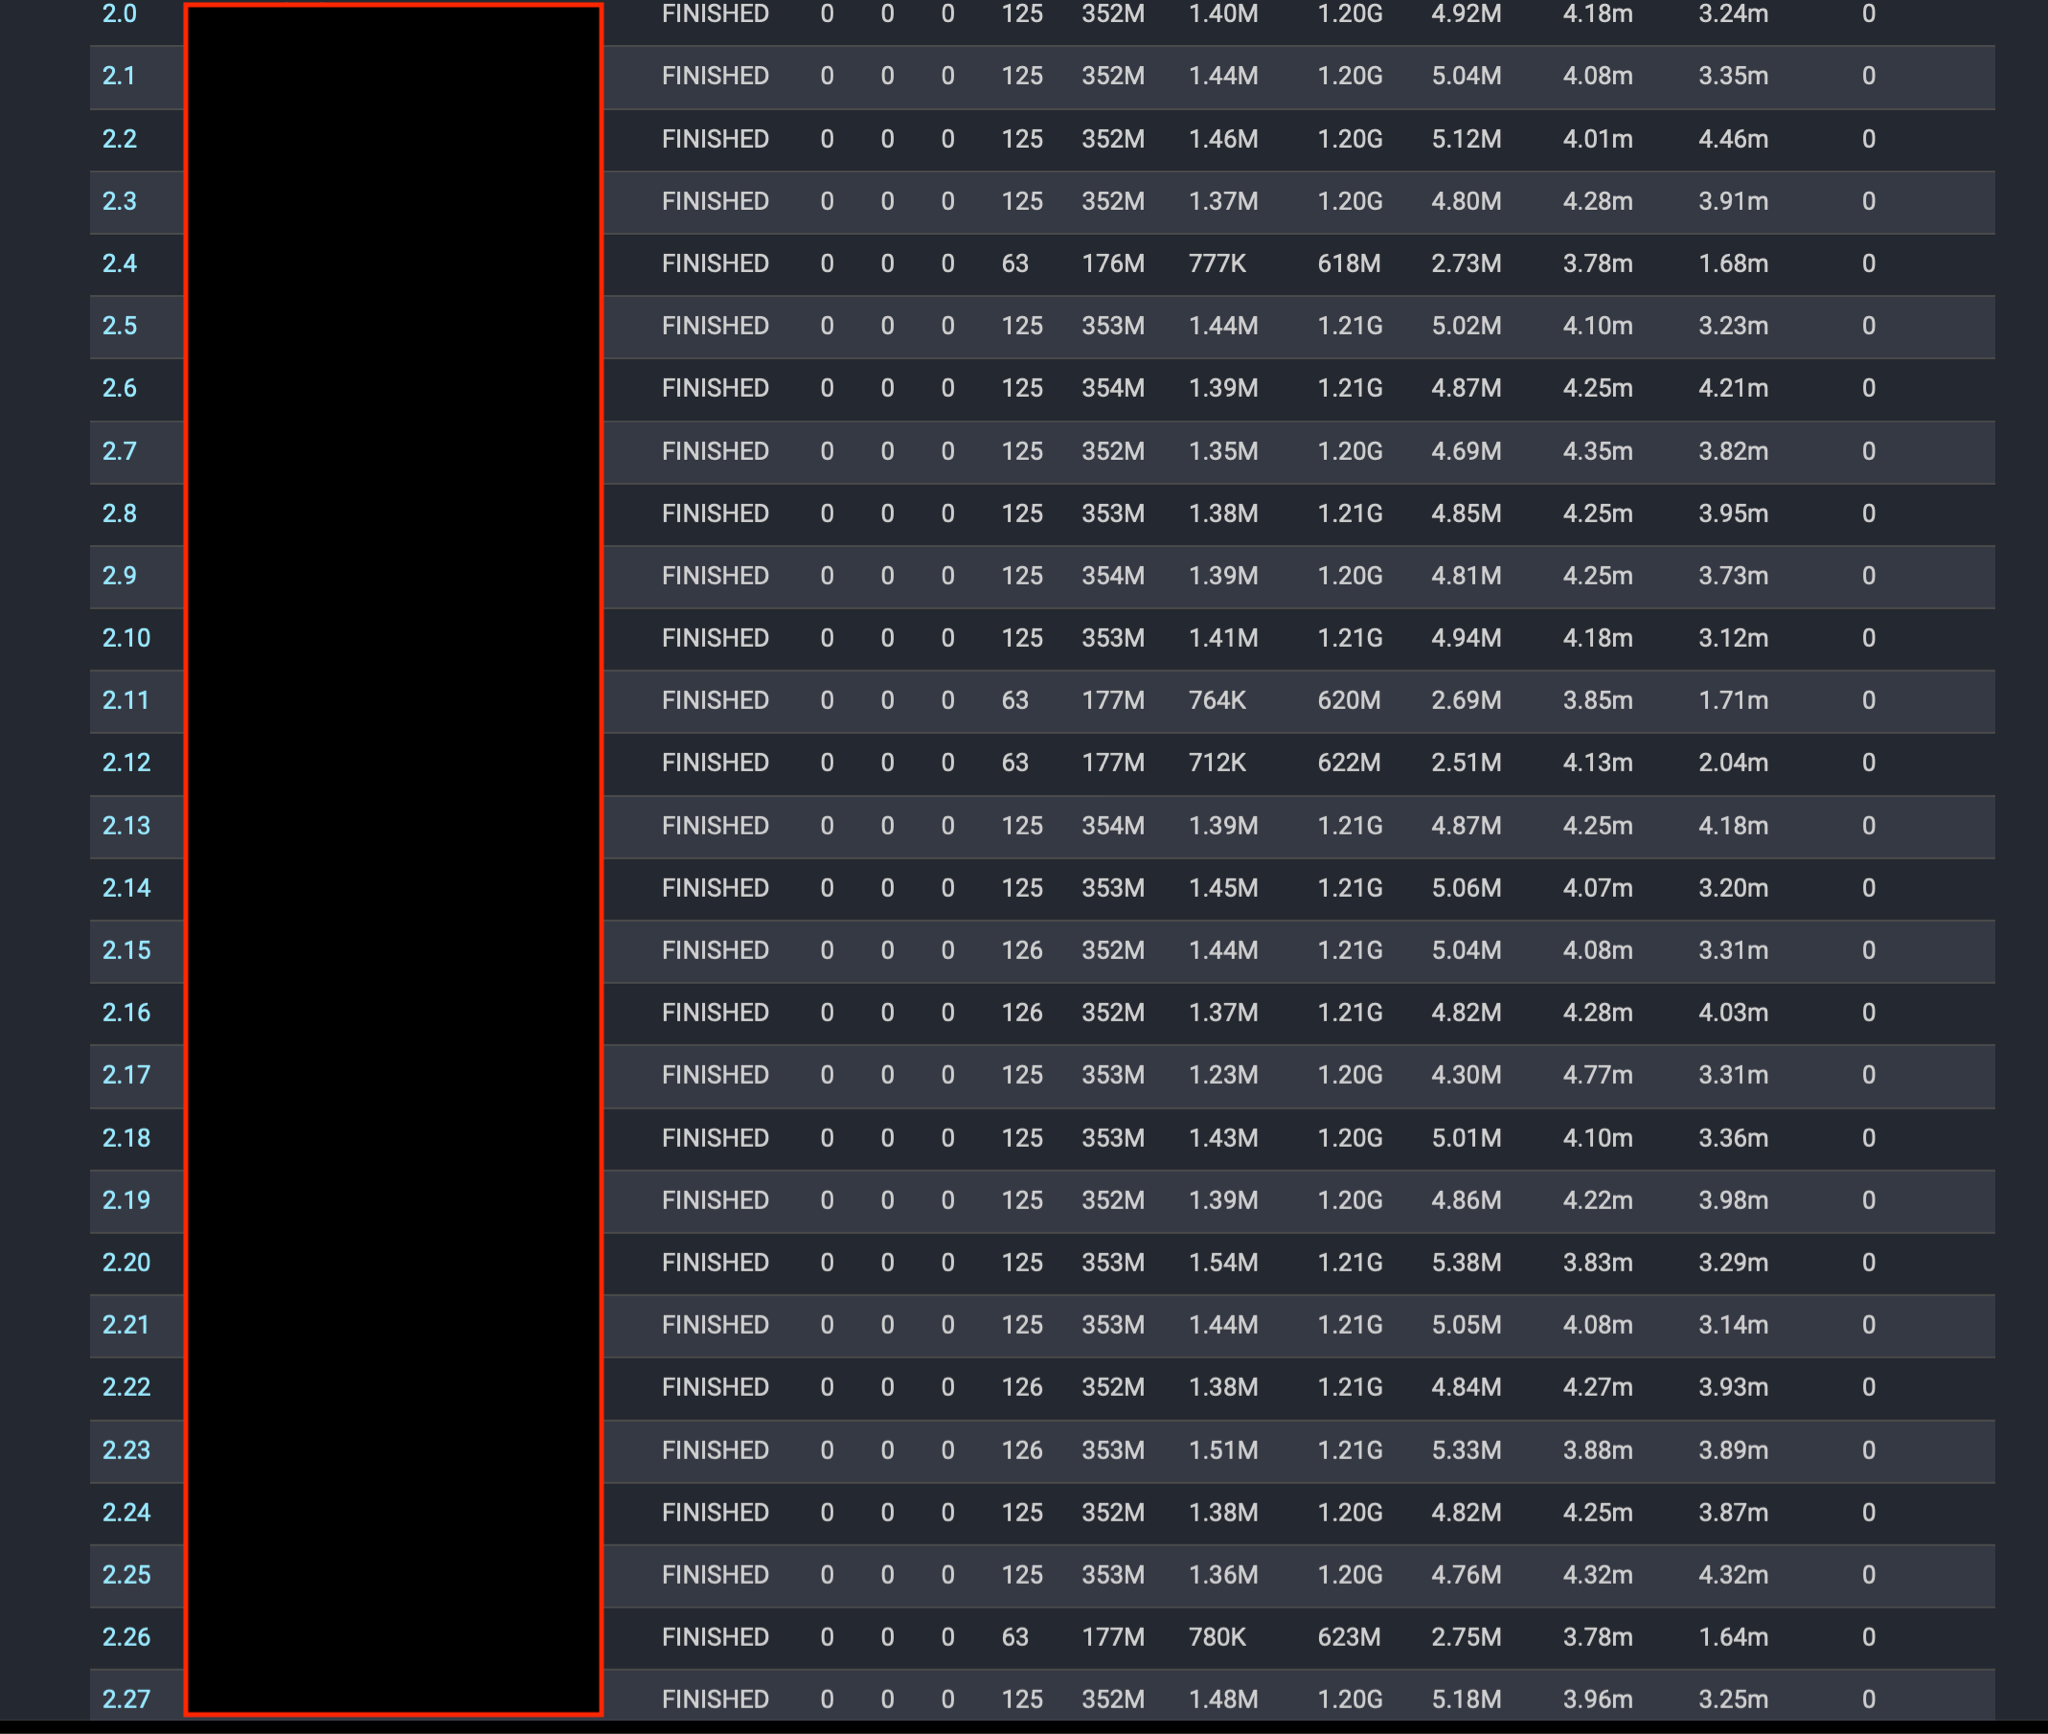
Execution time observed with the JVM options in place was 4 minutes and 51 seconds. The CPU stats for the scan/filter/project stage for this query now look like:
CPU: 3.22h, Scheduled: 7.21h, Input: 17631445897 rows (428.03GB)
The CPU used by individual tasks is much more uniform:
Code cache #
We noticed that the cluster’s overall CPU utilization decreased after the cluster was up for a few days, and there would be a few workers where tasks were running slow.
When looking at these workers with slow running tasks, we found that CPU usage was very high:
[root@worker-node log]# uptime
 21:36:57 up 20 days, 20:39,  1 user,  load average: 149.92, 152.83, 144.82
[root@worker-node log]#
We also noticed all these workers had messages like this in the launcher.log
file:
[219756.210s][warning][codecache] Try increasing the code heap size using -XX:ProfiledCodeHeapSize=
OpenJDK 64-Bit Server VM warning: CodeHeap 'profiled nmethods' is full. Compiler has been disabled.
OpenJDK 64-Bit Server VM warning: Try increasing the code heap size using -XX:ProfiledCodeHeapSize=
CodeHeap 'non-profiled nmethods': size=258436Kb used=235661Kb max_used=257882Kb free=22774Kb
 bounds [0x00007f466f980000, 0x00007f467f5e1000, 0x00007f467f5e1000]
CodeHeap 'profiled nmethods': size=258432Kb used=207330Kb max_used=216383Kb free=51101Kb
 bounds [0x00007f465fd20000, 0x00007f466f980000, 0x00007f466f980000]
CodeHeap 'non-nmethods': size=7420Kb used=1881Kb max_used=3766Kb free=5538Kb
 bounds [0x00007f465f5e1000, 0x00007f465fab1000, 0x00007f465fd20000]
 total_blobs=64220 nmethods=62699 adapters=1432
 compilation: disabled (not enough contiguous free space left)
              stopped_count=4, restarted_count=3
 full_count=3
Once the code cache is full, the JVM won’t compile any additional code until space is freed.
We were running with the -XX:ReservedCodeCacheSize JVM option set to 512M.
To see what’s taking up space in the code cache, we used jcmd:
jcmd <TRINO_PID> Compiler.CodeHeap_Analytics
We ran this at various intervals so we could compare how the code cache changed over time.
30 of the top 48 non-profiled methods were PagesHashStrategy, which are
generated per-query. These can’t be removed from the cache until the query is
completed, so the amount of cache needed is going to be relative to the
concurrency. We have a very busy cluster with significant concurrency at our
busiest times.
Next, we set -XX:ReservedCodeCacheSize to 2G to see how that would help. We
have not seen the code cache fill while the cluster has been running since
increasing the size to 2GB. We can also monitor the size of the code cache over
time using JMX. One query that can be used if you have the JMX catalog enabled
on your cluster is:
SELECT
    node,
    regexp_extract(usage, 'max=(-?\d*)', 1) as max,
    regexp_extract(usage, 'used=(-?\d*)', 1) AS used
FROM
  jmx.current."java.lang:name=codeheap 'non-profiled nmethods',type=memorypool"
ORDER BY used DESC
Off heap memory usage #
One final JVM issue we noticed in our production cluster was that off-heap memory on some workers grew to be quite large. We allocate approximately 85% of the physical memory on our workers for the JVM heap. Recently, we received alerts from our monitoring systems that memory consumption on our workers got dangerously close to the physical limit on the machines.
We noticed some memory related issues from the Alluxio client in the Trino worker logs on machines generating these high memory alerts. Upon further investigation, we noticed that Trino was running with the open source version of the Alluxio client. Trino ships with version 2.4.0 of the Alluxio client. We are an Alluxio customer and use it in our environment.
After discussing with Alluxio, they suggested we upgrade to version 2.4.1 of their Enterprise client which includes a fix for an off-heap memory leak bug. After upgrading to the Alluxio Enterprise client, the off-heap memory usage became a lot more stable.
Summary #
This post outlined some of the JVM issues we encountered while running Trino in production. Many of these issues we only hit in our production environment and were difficult to replicate outside of it. Thus, we wanted to write up our experience with the hopes of helping other Trino users in the future!