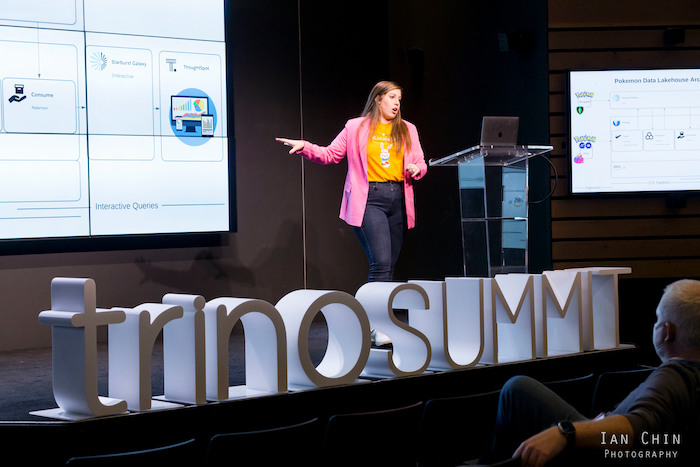
As the Trino Summit 2022 recap post series continues on, I have been reading all the wonderful posts by our awesome speakers, facilitated by the Trino developer relations team. Because I have a perpetual fear of missing out, I convinced them that I should get in on the fun. For this latest installment in the series, I will be recapping my very own Trino Summit talk. Basically, I’m ripping off Bo Burnham’s comedy bit where he reacts to his own reaction video, blog style.
In this session, I demonstrate building a data lakehouse architecture with Starburst Galaxy, the fastest and easiest way to get up running with Trino. Before I dive into the recap, I want to thank the Trino community for showing up. I am grateful that I was able to meet and learn from so many members of the community in person.
Recap #
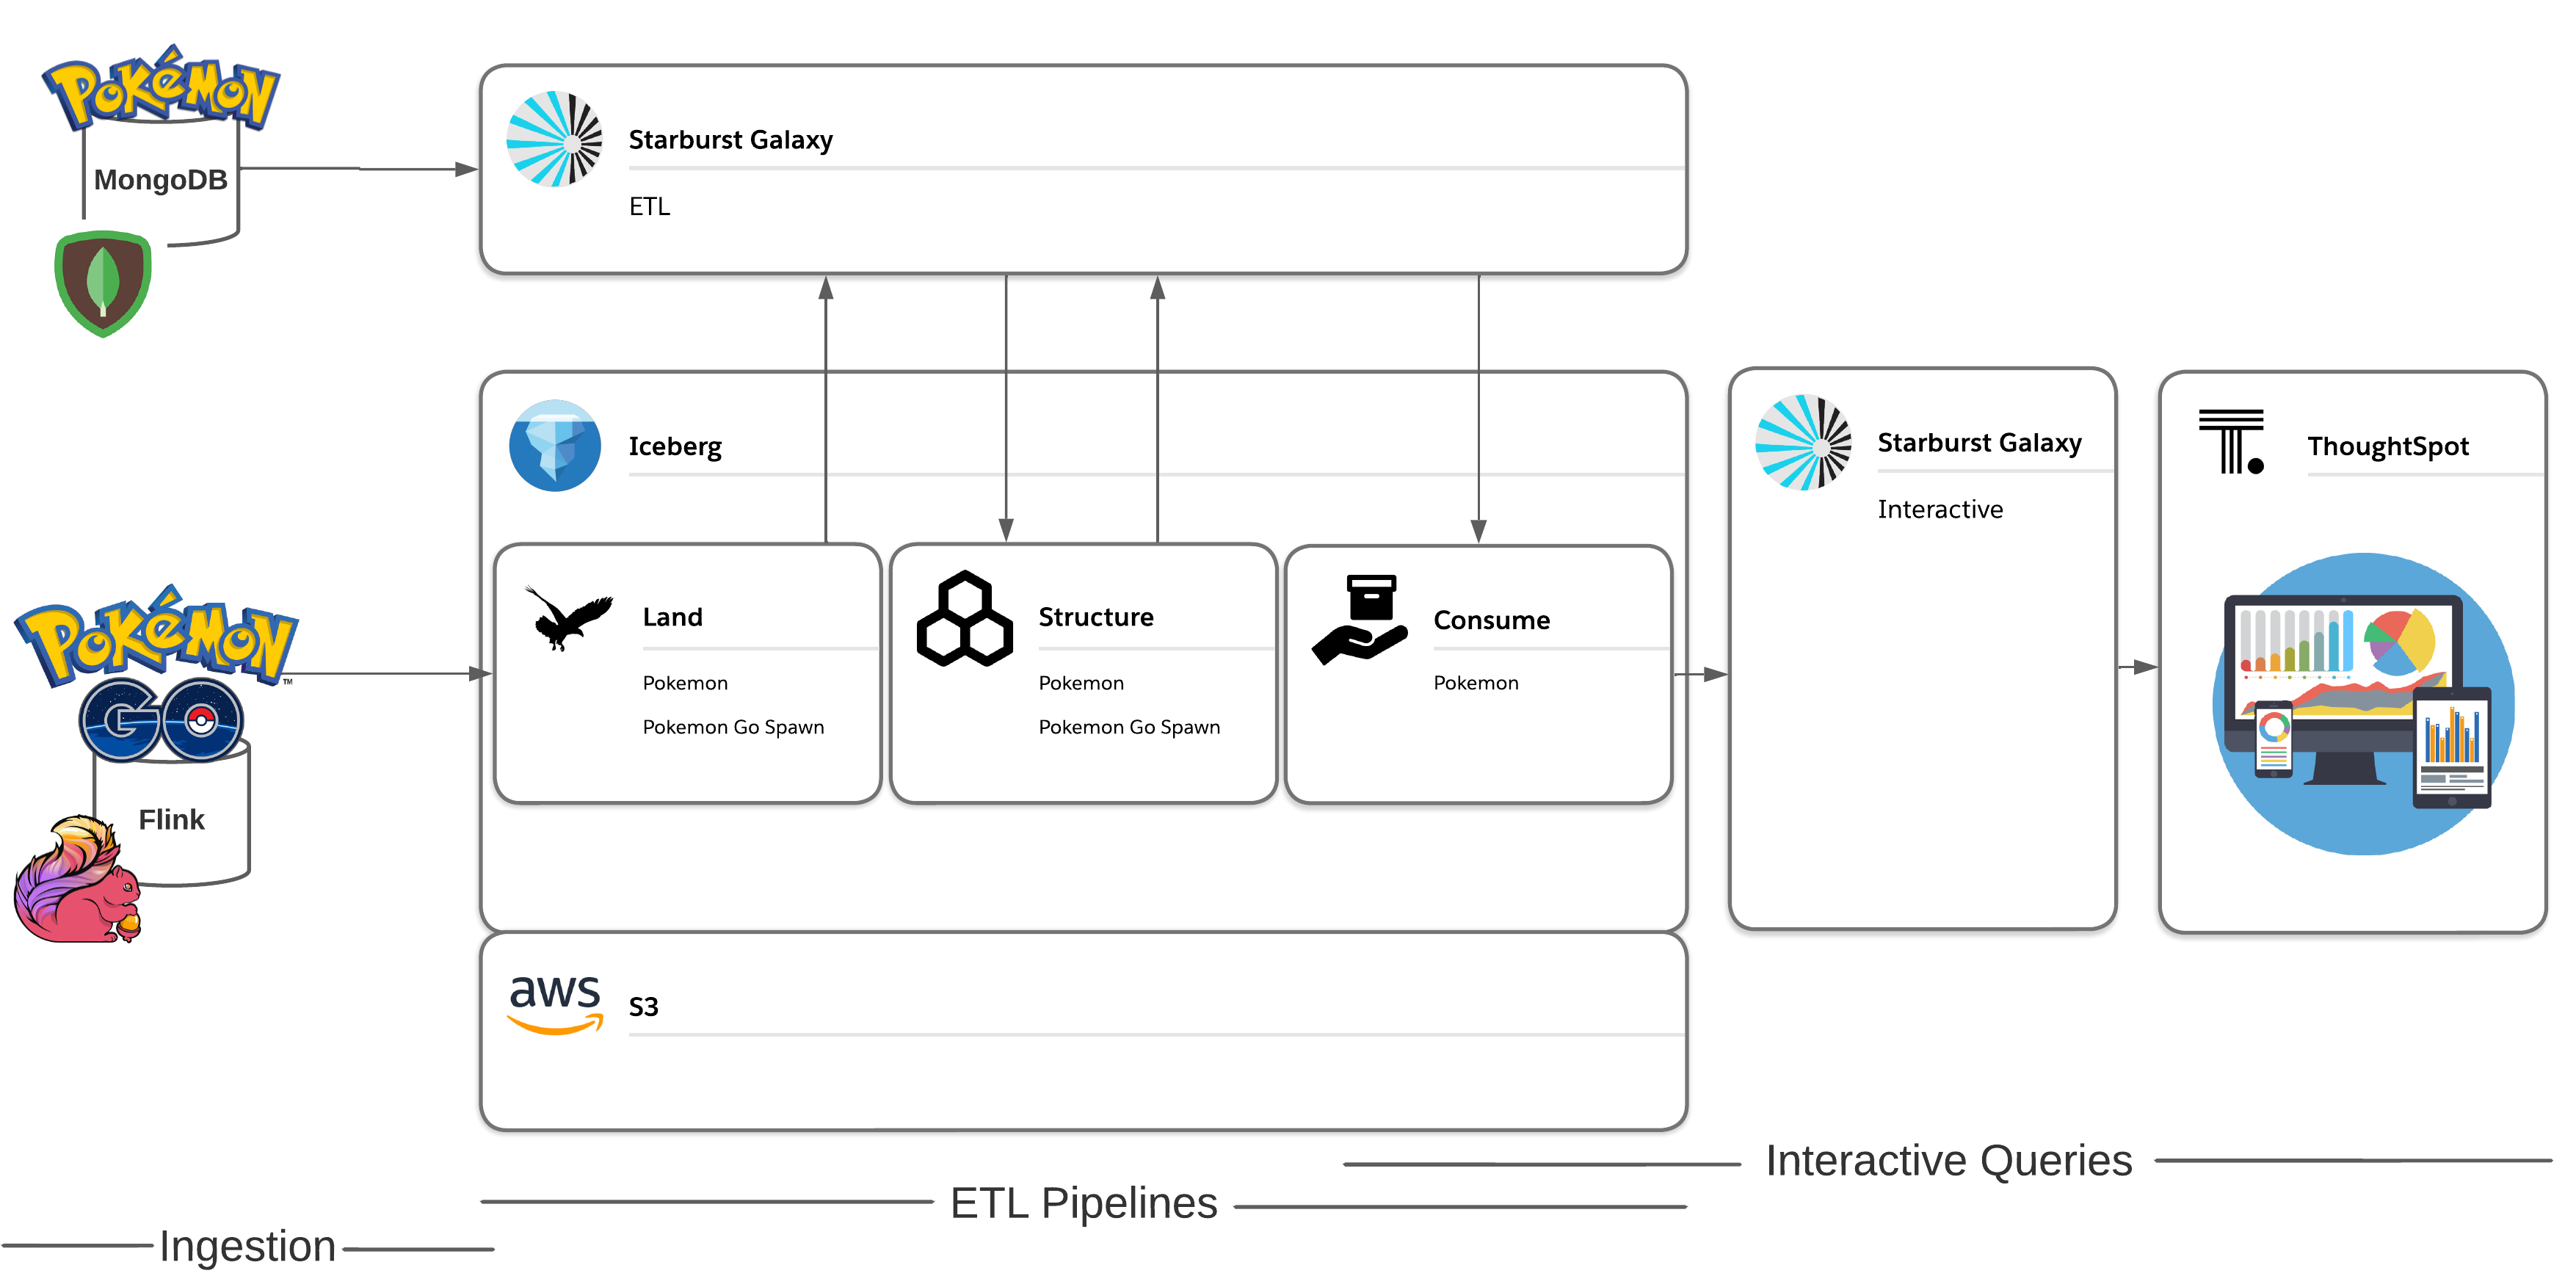
The premise of this example is that we have Pokémon Go data being ingested into S3, which contains each Pokémon’s encounter information. This includes the geo-location data of where each Pokémon spawned, and how long the Pokémon could be found at that location. What we don’t have is any information on that Pokemon’s abilities. That information is contained in the Pokédex stored in MongoDB which I’ve cleverly nicknamed PokéMongoDB. It includes data about all the Pokémon including type, legendary status, catch rate, and more. To create meaningful insights from our data, we need to combine the incoming geo-location data with the static dimension CSV table located in MongoDB.

To do this, I build out a reporting structure in the data lake using Starburst Galaxy. The first step is to read the raw data stored in the land layer, then clean and optimize that data into more performant ORC files in the structure layer. Finally, I join the spawn data and Pokédex data together into a single table that is cleaned and ready to be utilized by a data consumer. Next I apply role-based access control capabilities within Starburst Galaxy, which provides the proper data governance so that data consumers only have read permissions to that final table. I then create some visualizations to analyze which Pokémon are common to spawn in the San Francisco area.
I walk through all the setup required to put this data lakehouse architecture into action including creating my catalogs, cluster, schemas, and tables. After incorporating open table formats, applying native security, and building out a reporting structure, I have confidence that my data lakehouse is built to last, and end up with some really cool final Pokémon graphs.
Helpful links #
- Sign up for Starburst Galaxy
- Read the docs
- Try a tutorial for yourself
- Register for Datanova
Share this session #
If you thought this talk was interesting, consider sharing this on Twitter, Reddit, LinkedIn, HackerNews or anywhere on the web. Use the social card and link to https://trino.io/blog/2022/12/14/trino-summit-2022-starburst-recap.html. If you think Trino is awesome, give us a 🌟 on GitHub !
